| Topic
- • Algebra |

NumberSystem animation
This is an animated graphic on the Number System, all numbers being Complex Numbers. It breaks down the components of the Real Number System so that students can understand the hierarchy of numbers within this system.
|
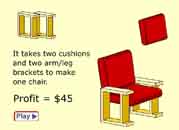
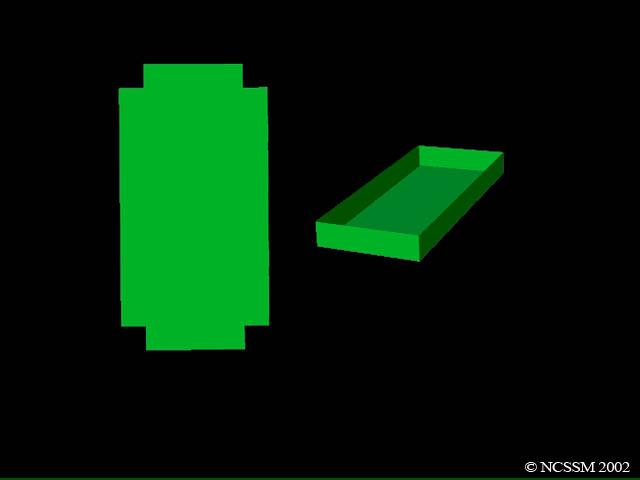
Product-MixProblem animation (GIF)
A
linear programming problem using pre-fabricated units to assemble
chairs and stools.
|
|
| Topic
- • Statistics |
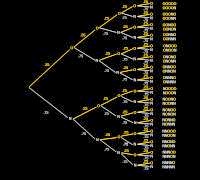
HereditaryTree_Diagram.gif
Shows
all the possible combinations of N & O in a hereditary tree.
 |
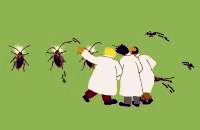
Roach Dissection animation
A
humorous introduction to t-distributions in which roaches are fed
glucose and then dissected for sampling to see how quickly their metabolism
absorbs the sugar. Based on an example in "The Basic Practice
of Statistics" by Moore, page 413.
|
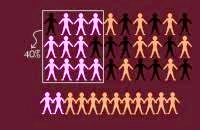
Jurors animation (GIF)
An animation shows
an example of sampling in selecting a jury, and the students are asked
to determine if the sample reflects the population.
View the text for this problem.
 |
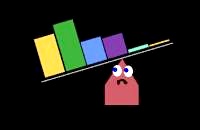
BalanceMean animation
An
animation showing that the mean of a distribution is the balance point
of its histogram.
|
9_Curves.ppt
A
PowerPoint containing the nine curves from the J.J. Flash animations
below showing several normal curves with different means and standard
deviations. (used as a discussion aid after showing the "JJ_Flash"
animations below, where tiny cartoon characters ("Jumping Jack
Flash") modify a curve into each of the nine different curves.)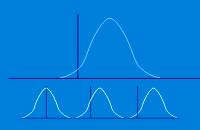
|
JJFlash-curve_A animation (GIF)
An
animation. (see adjacent 9_Curves.ppt.)
 |
JJFlash-curve_B animation (GIF)
An
animation. (see adjacent 9_Curves.ppt.)
|
JJFlash-curve_C animation (GIF)
An
animation. (see adjacent 9_Curves.ppt.)
|
Z_Slide animation (GIF)
An
animation where the area under a standard normal curve are shaded,
and the shaded area can be moved back and forth by manually toggling
through the "pages" of the animation.
|
M-n-Ms_Scoops animation (GIF)
An
animation - two different 3-sided scoops made from the same size flat
sheet of board dip into a pile of M&M candies. Which scoop holds
the most? The volume differs because the sides and bottoms are different
measurements.
|
|
|
| Topic
- • Precalculus / Trigonometry
|
FerrisWheel-NoDots animation
and FerrisWheelWithDots animation
A
pair of animations of the side-view of a double ferris wheel showing
the path taken by a passenger as he travels around the ferris wheel.
The first animation just shows the wheel turning, while the second
animation leaves "tracer" dots behind in the path of the
rider showing the path taken. This is used in conjunction with "Trig
in the Real World", and parametric equations.
 |
Monkeys-Pendulum animation
This animation provides a fun way to compare the arc of two pendulums, a pair of monkeys whose tails are of different lengths swing out to gather bananas. Students visualize the movement of a pendulum and the central angles arc length.
 |
OneMonkeyPendulum animation
This
animation of a monkey swinging out to gather bananas provides a fun way for students to visualize the movement of
a pendulum and the central angles arc length.
 |
Joan'sHeadache animation
The
exponential decay of a drug in a person's system.
 |
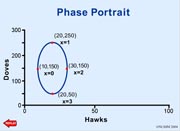
Hawks-Doves_PhasePortrait animation
This
animation shows the use of trigonometric functions to model a common
periodic phenomena of the rise and fall of two populations: hawks
and doves.
 |
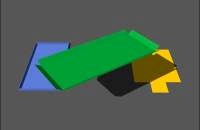
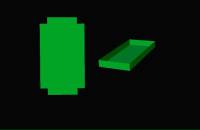
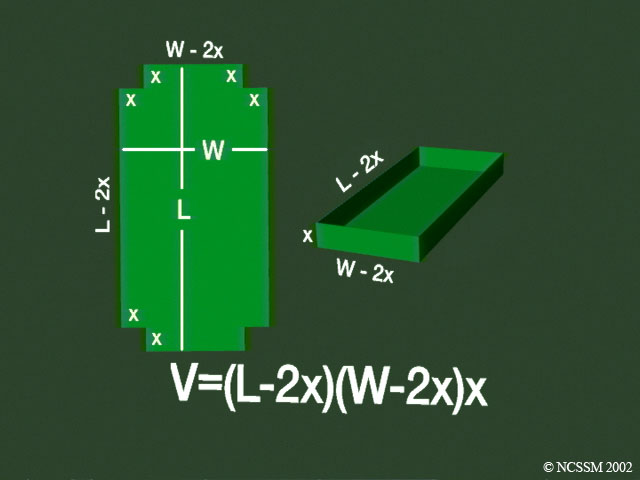
BoxProblem animation
An
animation showing three identical size sheets of cardboard folding
into three open-top boxes, each with different bottom and side dimensions.
This is used to show how the various size squares give different volumes
of space inside, although they are made from the same size of raw
material. Also there is an optimum volume which can be reached using
any one size of raw material (a Max/Min problem for Calculus or
below).
 |
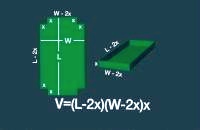
BoxProblem_with_labels.jpg
or BoxProblem_template.jpg
 Two
still images used in conjunction with "Box Problem"
animation above. One has the formula and labels, and one is
blank so the instructor can use it in a powerpoint or other
application and add text labels and values as desired. Two
still images used in conjunction with "Box Problem"
animation above. One has the formula and labels, and one is
blank so the instructor can use it in a powerpoint or other
application and add text labels and values as desired.
 |
X-Y_Graph_A_anim animation
This animation plays an X graph, then a Y graph, then allow you to view the X-Y data being graphed
concurrently with the individual X and Y graphs.
 |
X-Y_Graph_B animation
This animation plays an X graph,
then a Y graph, then allow you to view the X-Y data being graphed
concurrently with the individual X and Y graphs.
 |
X-Y_Graph_C animation
This animation plays an X graph,
then a Y graph, then allow you to view the X-Y data being graphed
concurrently with the individual X and Y graphs.
 |
X-Y_Graph_D animation
This animation plays an X graph,
then a Y graph, then allow you to view the X-Y data being graphed
concurrently with the individual X and Y graphs.
 |
X-Y_Graph_E animation
This animation plays an X graph,
then a Y graph, then allow you to view the X-Y data being graphed
concurrently with the individual X and Y graphs.
 |
X-Y_Graph_F animation
This animation plays an X graph,
then a Y graph, then allow you to view the X-Y data being graphed
concurrently with the individual X and Y graphs.
 |
EngineDisplacement animation
This
animation shows the steps in converting Liters into cubic inches
in order to compare the displacement of two engines, one of which
is described in Liters, and the other described in cubic inches.
 |
|
