| Topic
- • Gases |

ClosedManometer-640.gif
This illustration
shows the setup of a closed manometer.
 |
OpenManometerA-640.gif
This illustration
shows the setup of an open manometer.
 |
OpenManometerB-640.gif
This illustration
shows the data for an open manometer where the gas pressure is less
than the atmospheric pressure.
 |
OpenManometerC-640.gif
This illustration
shows the data for an open manometer where the gas pressure is greater
than the atmospheric pressure.
 |
Different_Speeds_of_Gases-640.gif
This diagram shows
the position of the most probable speed, the average speed, and the
root mean square speed on the graph of the distribution of molecular
speeds of gas molecules.
 |
GasMotion-640.gif
This illustration
shows a demonstration of the fact that gas molecules travel at high
speeds in a straight line.
 |
MolecularSpeed_vs_MM-640.gif
This diagram shows
the distribution of molecular speeds for different gases at a given
temperature.
|
MolecularSpeed_vs_Temp-640.gif
This diagram shows
how the distribution of the molecular speeds of oxygen gas varies
with temperature.
 |
MolecularDistribution animation
This animation
shows the generation of a
molecular speed distribution graph using metal vapor.
 |
Avogadro'sLaw animation
This animation
shows how the volume of a gas changes with the number of moles of
gas at constant temperature and pressure.
 |
BoylesLaw animation
This animation
shows how the pressure of a gas changes with the volume of gas at
constant temperature and moles.
 |
Charles Law Animation
This animation
shows how the volume of a gas changes with the temperature of gas
at constant pressure and moles.
 |
Gay-Lussac's Law animation
This animation
shows how the pressure of a gas changes with the temperature of gas
at constant volume and moles.
 |
AtmosphericPressure animation
This animation
shows how atmospheric pressure is exerted on a person and how it is
calculated.
 |
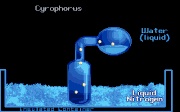
Cyrophorus animation
An animation showing
a sealed container of water and Cyrophorus inserted into liquid nitrogen
to cool. This shows how the higher energy water molecules escape from
the liquid water and are condensed in the part of the tube immersed
in the liquid nitrogen. This lowers the average kinetic energy and
temperature of the remaining liquid water. Eventually the temperature
of the water decreases enough to freeze.
 |
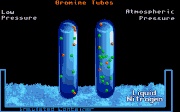
Bromine animation
This animation
shows sealed vials of Bromine, one under low pressure & one at
atmospheric pressure, which are put into liquid nitrogen to cool.
The molecules of bromine in the lower pressure tube condense to the
solid faster because there are fewer molecules of air to collide with
due to the low pressure. The bromine molecules travel further between
collisions and reach the cold surface faster and condense faster.
 |
MolecularMotion animation
An animation that
shows orange and green beads inside a sealed vial of liquid mercury.
When the liquid mercury is heated and the atoms of mercury vapor strike
the colored beads, it bounces them around. This illustrates collisions
with gas phase particles.
 |
|
| Topic
- • Bonding |
NonpolarCovalentBonding animation
This animation
shows the sharing of electrons and the formation of a nonpolar covalent
bond.
 |
IonicBonding animation
This animation
shows the transfer of electrons from a metal to a nonmetal to form
ions and the structure of an ionic crystal.
 |
PolarBonding
This animation
shows the formation of polar
covalent bonds. Two molecules with different geometries are shown.
 |
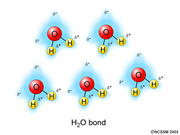
H2O_bond.jpg
This diagram shows
the hydrogen bonding in water.
 |
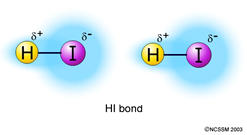
HI_bond.jpg
This diagram shows
the dipole force in HI.
 |
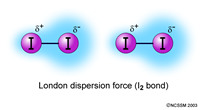
LondonDispersionForce_I2_bond.jpg
This diagram shows
the London dispersion force in I2.
 |
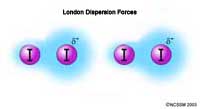
LondonDispersionForce animation
This animation
shows the London dispersion force in I2.
 |
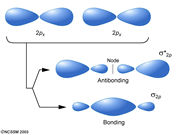
p_sigma_bonding.jpg
This
diagram shows the formation of sigma bonding molecular orbitals.
 |
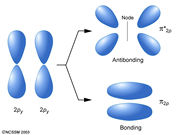
p_pi_bonding.jpg
This diagram shows
the formation of pi bonding molecular orbitals.
 |
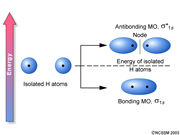
Molecular_1s_orbitals-1.jpg
This
diagram shows the formation of bonding and antibonding molecular orbitals
from s type atomic orbitals.
 |
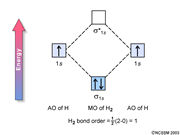
Molecular_1s_orbitals-2.jpg
This diagram shows
the distribution of electrons in the molecular orbitals of diatomic
hydrogen.
 |
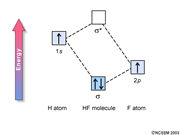
Hetero-Molecular_orbitals.jpg
This
diagram shows the distribution of electrons in the molecular orbitals
of diatomic hydrogen fluoride.
 |
BondingEnergy.gif
This diagram shows
the relative energy of the bonding and antibonding molecular orbitals.
 |
Diatomic-Molecular_orbitals-1.gif
This
diagram shows the distribution of electrons in the molecular orbitals
of Period 2 diatomic nonmetallic elements.
 |
Diatomic-Molecular_orbitals-2.gif
This diagram shows
the distribution of electrons in the molecular orbitals of Period
2 diatomic metallic elements.
 |
Diatomic-Molecular_orbitals-3.gif
This
diagram shows the distribution of electrons in the molecular orbitals
of Period 2 diatomic nonmetallic elements.
 |
Bonding_Orbital.gif
This diagram shows
the combination of electron probabilities in a bonding molecular orbital.
 |
Antibonding_Orbital.gif
This
diagram shows the combination of electron probabilities in a bonding
molecular orbital.
 |