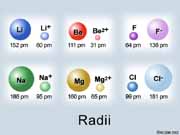
Radii.jpg
This diagram shows
the relationship between atomic and ionic radii for some metals and
nonmetals.
Topic
- • Nuclear
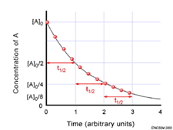
1st_order_kinetics-a.gif
This diagram shows
the relationship between concentration and time for first order kinetics.
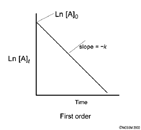
1st_order_kinetics-b.gif
This diagram shows
the re-expression of relationship between concentration and time for
first order kinetics to produce a linear relationship.
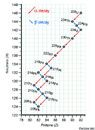
Band_of_stability_1.gif
This diagram shows
a graph of neutrons versus protons for non-radioactive isotopes and
illustrates the band of stability.
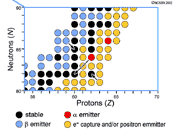
Band_of_stability_2.gif
This illustration
shows a close-up of a section of the band of stability and shows the
types of decay a radioactive isotope might undergo to become stable.
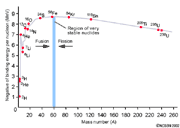
BindingEnergy_vs_mass.gif
This diagram shows
the relationship between the nuclear binding energy of an isotope
and its atomic mass.
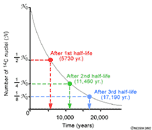
DecayKinetics.gif
This diagram shows
the decay for several half-lives of the C-14 isotope.
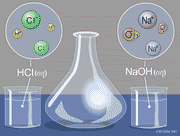
DoubleDisp_Reaction-AcidToBase animation
HCl(aq)+NaOH(aq)
--> NaCl(aq)+H2O(l)
This animation shows the double displacement and acid base reaction
between a strong acid and a strong base.
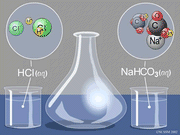
DoubleDisp_Reaction-GasProduction animation
NaHCO3(aq)+HCl(aq)
--> H2O(l)+NaCl(aq)
This animation shows the double displacement
and acid base reaction between a strong acid and
a metal carbonate to form carbon dioxide.
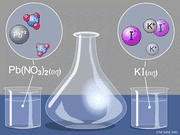
DoubleDisp_Reaction-Precipitation animation
Pb(NO3)2(aq)+2KI(aq)
--> PbI2(s)+2KNO3(aq)
This animation shows the double displacement reaction between two
soluble ionic compounds to form a slightly soluble precipitate.
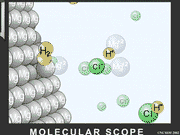
SingleDisp_Reaction-MetalToAcid animation
Mg(s)+2HCl(aq)
--> MgCl2(aq)+H2(g)
This animation shows the single displacement reaction between a metal
and a strong acid to form hydrogen gas.
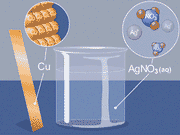
SingleDisp_Reaction-MetalToMetal animation
This animation
shows the single displacement reaction between a metal and a metal
ion to form a new metal and a new metal ion.
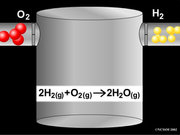
Synthesis animation
2H2(g)+O2(g)
--> 2H2O(g)
This animation shows the synthesis reaction between two nonmetals.
Topic
- • Stoichiometry
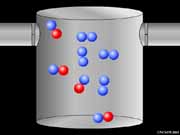
LimitingReactant animation
This animation
shows a reaction with a limiting reactant and excess reactant remaining
at the end of the reaction.
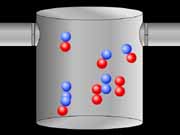
Stoichiometry animation
This animation
shows a reaction where the reactants are in the same ratio as the
coefficients in the balanced equation.