| Topic
- • Equilibrium |

Equilibrium-1.gif
or (version with
arrows) or (version for
quiz)
This diagram shows
the formation of an
equilibrium mixture with a high product to
reactant ratio.
 |
Equilibrium-2.gif
or (version with
arrows) or (version for
quiz)
This
diagram shows the formation of an equilibrium mixture with a low product
to reactant ratio.
 |
Disturbing_Equilibrium.gif
This diagram shows
the shift in the position of an equilibrium by adding a reactant.
 |
Ea_Endothermic.gif
This diagram shows
the energy of activation for an endothermic reaction.
 |
Ea_Exothermic.gif
This diagram shows
the energy of activation for an exothermic reaction.
 |
Solubility_of_AgCl animation
This animation
shows the equilibrium between an ionic solid and the ions in solution
for slightly soluble AgCl.
 |
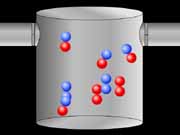
N2-O2_Equilibrium animation
This animation
shows a gas phase equilibrium system.
|
CaO-CaCO3 animation
This animation
shows a solid and gas equilibrium system and the effect adding additional
solid on the position of the equilibrium.
 |
2NO2-N204 animation
This animation
shows the effect of change
the volume of a gas phase equilibrium mixture where the numbers of
reactant and product molecules are different.
 |
H2I2_equilibrium animation
This animation
shows the effect of change the volume of a gas phase equilibrium mixture
where the numbers of reactant and product molecules are the same.
 |
|
|
| Topic
- • Kinetics |
1stOrderKinetics-640.gif
This diagram shows
a first order kinetics graph.
 |
2ndOrderKinetics-640.gif
This diagram shows
a second order kinetics graph.
 |
EnergyOfActivation-640.gif
This graph shows
the relationship between the energy of activation and the temperature
of a reaction.
 |
Catalyst.gif
This diagram shows
a potential energy diagram for a catalyzed and uncatalyzed multi-step
reaction.
 |
Catalyst-2.gif
This diagram shows
a potential energy diagram for a catalyzed and uncatalyzed one-step
reaction.
 |
COplusCl2_ver_1-640.gif
This diagram shows
a potential energy diagram for a multi-step mechanism.
 |
NOplusH2_ver_1-640.gif
This diagram shows
a one-step mechanism for a reaction.
 |
NOplusH2_ver_2-640.gif
This diagram shows
a two-step mechanism for a reaction with the first step being rate
determining.
 |
NOplusH2_ver_3-640.gif
This diagram shows
a two-step mechanism for a reaction with the second step being rate
determining.
 |
NOplusH2_ver_4-640.gif
This diagram shows
a two-step mechanism for a reaction with the first step being rate
determining but with a different intermediate.
 |
NOplusH2_ver_5-640.gif
This diagram shows
a two-step mechanism for a reaction with the second step being rate
determining but with a different intermediate.
 |
ReactionRate-640.gif
This diagram shows
the calculation of the rate of reaction at different points in the
reaction.
 |
Catalyst_1 animation
This animation
shows a solid state catalysis.
 |
Catalyst_2 animation
This animation
shows the solid state catalytic hydrogenation of an alkene.
 |
EnzymeCatalyst animation
This animation
shows the basic function of a enzyme as a catalyst.
 |
Molecular_collision_Ea animation
This animation
shows the change in potential energy as two molecules collide.
 |
Energy_of_Activation animation
This animation
shows the change in the number of molecules with energy greater than
the energy of activation as the temperature increases.
 |
|