Topic - • Acid-Base

ProtonTransfer_a.gif
This illustration shows the transfer of a proton from a strong acid to water.

ProtonTransfer_b.gif
This illustration shows the transfer of a proton from water to a weak base.

AcidicProp-OxidesPeriodicTable.gif
This chart shows the acidic and basic
properties of metal and nonmetal oxides.

pH_RangeForColorChange.gif
This chart shows the pH color range for several acid-base indicators.
pH_scale.gif
This diagram shows the relationship between pH and hydronium ion concentration and shows the pH of several common substances.
TitrationCurve-StrongAcid.gif
This illustration shows the titration curve of a strong acid with a strong base with indicator changes.
TitrationCurve-WeakAcid.gif
This illustration shows the titration curve of a weak acid with a strong base with indicator changes.
StrongAcidTitration-1.gif
This illustration shows the titration curve of a strong acid with a strong base.
StrongBaseTitration-1.gif
This illustration shows the titration curve of
a strong base with a strong acid.

StrongAcid-WeakAcid.gif
This illustration shows the titration curve of a mixture of a strong and a weak acid with a strong base.
Titration-vs-Ka.gif
This illustration shows the titration curves
of several weak acids with a strong base.

StrongAcidTitration-General.gif
This illustration shows the general titration curve of a strong acid with a strong base.
WeakAcidTitration-General.gif
This illustration shows the titration curve of
a weak acid with a strong base with indicator changes.

WeakBaseTitration-General.gif
This illustration shows the titration curve of a weak base with a strong acid with indicator changes.
PolyproticAcidTitration.gif
This illustration shows the titration curve of
a polyprotic weak acid with a strong base.

PolyproticBaseTitration.gif
This illustration shows the titration curve of a polyprotic weak base with a strong acid.
PhosphoricAcidTitration.gif
This picture shows the titration curve of the
triprotic weak acid, phoshoric acid, with the
strong base, sodium hydroxide.

WeakAcidEquilibrium animation
This animation shows the low percent ionization of a weak acid in water.
StrongAcidIonization animation
This animation shows the 100% percent
ionization of a strong acid in water.

DistributionCurve-Di.gif
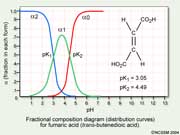
This diagram shows the distribution of the different species from the diprotic acid, fumaric acid, as a function of pH.
DistributionCurve-Mono.gif
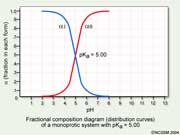
This diagram shows the distribution of the
different species from a monoprotic acid with a pKa = 5.00 as a function of pH.

DistributionCurve-tri.gif
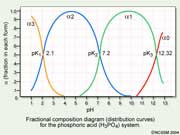
This diagram shows the distribution of the different species from the triprotic acid, H3PO4, as a function of pH.
   
Topic - • Electrochemistry
ElectrochemCell_pt_1 animation
Part One in a set of six Flash animations
with narration
explaining how a voltaic cell works.

ElectrochemCell_pt_2 animation
Part Two in a set of six Flash animations with narration explaining how a voltaic cell works.
ElectrochemCell_pt_3 animation
Part Three in a set of six Flash animations
with narration
explaining how a voltaic cell works.

ElectrochemCell_pt_4 animation
Part Four in a set of six Flash animations with narration explaining how a voltaic cell works.
ElectrochemCell_pt_5 animation
Part Five in a set of six Flash animations
with narration
explaining how a voltaic cell works.

ElectrochemCell_pt_6 animation
Part Six in a set of six Flash animations with narration explaining how a voltaic cell works.
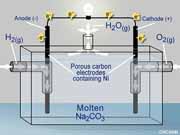
FuelCell-640x480.jpg
This illustration shows the components of a
H2 and O2 fuel cell used to generate an
electrical current.

Zinc-Copper_Diagram.gif
This illustration shows the components of a copper-zinc electrochemical cell.
Farady1.gif
This illustration shows the apparatus to
determine Faraday’s constant using the
electrolysis of water.

Farady2.gif
This illustration shows the apparatus to determine Faraday’s constant using the electroplating of copper.
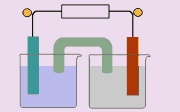
Battery_Template.gif
A simple flat-color diagram of the parts of a
voltaic cell . There are no labels so it can be used as a base graphic to illustrate various combinations of metals, solutions and direction of electron flow. For example, put it into a PowerPoint and add text labels.

thumbnail
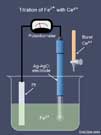
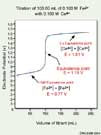
RedoxTitrationSetup.jpg
This diagram shows the setup for the redox titration of Fe2+ with Ce4+.
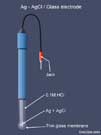
SilverElectrode.jpg
This diagram shows the structure of a saturated Ag/AgCl reference electrode.
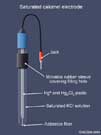
CalomelElectrode.jpg
This diagram shows the structure of a saturated calomel reference electrode.
Fe-CeTitrationCurve.gif
This diagram shows the redox titration curve
of Fe2+ with Ce4+.

TitrationCurvesVSvoltage.gif
This diagram shows the redox titration curves of compounds with different reduction potentials.
Fe-MnO4TitrationCurve.gif
This diagram shows the redox titration curve of Fe2+ with MnO4-.
 
Back to TOP - Menu < Previous Next >