| Topic
- • The Basics - elements and measures |

DiscoveryOfElementsTimeline.gif
This diagram shows
a historical timeline for
the discovery of the elements and some of the methods used to isolate
them.
|
ElementsInEarthsCrust.gif
This diagram shows
the relative mass percent of some of the common elements in the earth's
crust.
|
ElementsInHumanBody.gif
This diagram shows
the relative mass percent of some of the common elements in the human
body.
 |
|
|
Metals-NonmetalsTable.gif
This diagram is
a Periodic Table showing the metals, nonmetals, and metalloids.
|
ModernPeriodicTable.gif
This diagram is
a Periodic Table showing the classification of the different groups
of elements.
 |
Thermometers.gif
This illustration
compares the Celsius, Kelvin, and Fahrenheit temperature scales.
|
M3_DM3_CM3
This
HTML5 animation visually compares the relationship between a cubic
meter, cubic decimeter, cubic centimeter, and cubic milllimeter.
|
|
| Topic
- • Atomic Structure
|
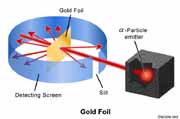
GoldFoilExperiment.jpg
This illustration
shows the bombardment of a thin gold foil with alpha particles from
a radioactive element.
|
GoldDescription500x475.gif
This illustration
shows the deflection of the alpha particles as they pass through the
gold foil.
|
CRT-Plates640.gif
This illustration
shows the deflection of a beam of electrons using electrically charged
plates.
|
CRT-Magnet640.gif
This illustration
shows the deflection of a beam of electrons by a magnetic field.
|
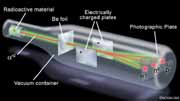
Canal_Ray.jpg
or Canal_Ray-CRT animation
This
illustration and animation shows the
formation cathode rays (electrons) and canal rays (protons) produced
by hitting hydrogen atoms with high energy electrons in a vacuum tube.
|
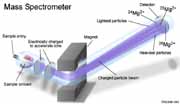
MassSpectrometer-640.jpg
This illustration
shows the components of a mass spectrometer and the separation of
the isotopes of magnesium.
 |
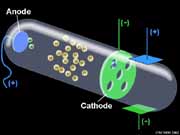
NeutronTube.jpg
This illustration
shows the separation of
protons, electrons, and neutrons using
electrically charged plates.
 |
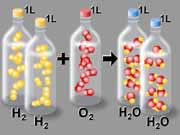
OneLiterH2O-640.jpg
or
OneLiterH2O Animation
This illustration
and animation demonstrates the ratio of the combining volumes of hydrogen
and oxygen gas to form water.
 |
OilDrop Animation
This HTML5 animation
provides an interactive virtual experiment for Millikans Oil Drop
experiment.
 |
P-Orbital animation
This animation
isolates and highlights the user-selected individual axis of a P orbital.
 |
ElectronEnergyLevels-640.gif
This illustration
shows the increase in potential energy as an electron moves from the
ground state to different excited states.
 |
ElectronEnergySteps-640.gif
This diagram shows
the relationship between potential energy and radius for the energy
levels in a hydrogen atom.
 |
Fireworks_CrossSection640.gif
This illustration
shows the components of a typical aerial shell firework.
 |
X-raySpectra.gif
This diagram shows
the relationship between the x-rays emitted by an element and the
atomic number of the element.
 |
Spectrum
Charts (.gif images)
This
is a set of Spectrum Charts for the
following elements:
Ba,
Ca,
Cd,
H,
He,
Hg,
Li
and Na.
 |
FullSpectrumDiagram.gif
This illustration
shows the different regions of the electromagnetic spectrum.
 |
Waves1-640.gif
This illustration
shows the amplitude and
wavelength of a light wave.
 |
Waves2-640.gif
This illustration
shows the relationship between wavelength and frequency for different
regions of the electromagnetic spectrum.
 |
MoseleyExperiment.gif
This illustration
shows the generation of
x-rays by bombarding a metal with high
energy electrons.
 |
Car-LightBends animation
This
animation shows an analogy of the bending of a car's path and the
refraction of light by a prism.
 |
ElectronSpin animation
This animation
shows the two possible spin states for an electron.
 |
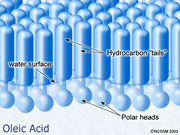
OleicAcid.jpg
This illustration
shows the packing of the oleic acid molecules in a film of oleic acid
on water.
 |
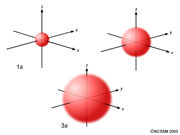
s-orbitals_3-up.jpg
Individual s-orbital
diagrams: 1s,
2s,
3s
This illustration shows the relative volume of the 1s, 2s, and 3s
orbitals. The individual
orbitals can be viewed separately.
 |
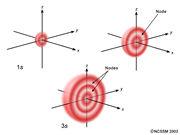
s-orbitals_3-up_withNodes.jpg
Individual s-orbital
with Nodes diagrams: 1s,
2s,
3s
This illustration shows the electron probability distribution and
nodes for the 1s, 2s, and 3s orbitals. The individual orbitals can
be viewed separately.
 |
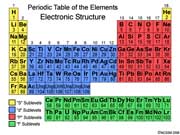
PeriodicTable-Sublevels.gif
This diagram shows
the Periodic Table with the electron sublevels.
 |
ElectronOrbits animation
This animation
shows the absorption and
emission of photons by a hydrogen atom.
 |
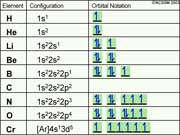
OrbitalNotation.gif
This diagram shows
the electron configuration and orbitals notation for several elements.
 |